
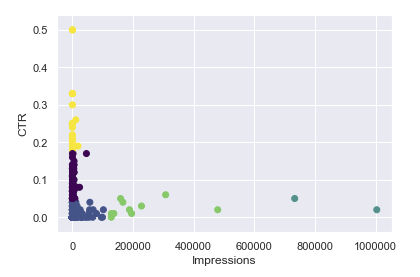
At right is the output of a cluster analysis on a series of keywords (marketer jargon for the search terms you type into Google), pulled from Google Search Console (a hub for webmasters to check on the SEO health of their websites), which will cluster keywords based on impressions (number of people who see the search result) and click-through rate (ratio of clicks to impressions).
High impressions, by itself, doesn't mean anything: it could just be the sort of query that a ton of people search for on a regular basis (we SEOs call this "high search volume"). High click-through rate (or CTR) also doesn't mean anything by itself: it could be a branded term, like the copyrighted name of your business or product. But certain combinations of impressions and CTR can tell you valuable information. In particular, it can tell you if your metadata need to be optimized.
Web developers will know all about this part. When you search for something, what you see on the results page are two specific pieces of metadata: the meta title and meta description. The fact that this is what searchers are going to see means that creating compelling meta titles and descriptions is pretty much the single best way to improve your CTR. But, for a webmaster of a huge site with hundreds or thousands of pages, how to prioritize?
That question inspired this project. I wanted to give businesses running large websites a way to prioritize which metadata they need to optimize, according to the combination of impressions and CTR.
The priority order always goes like this. Keywords with high impressions and low CTR are the highest priority, because fixing the metadata on these pages has the highest potential for returns. If a lot of people are seeing your result - and given how people search for things, that means you're on page 1 of Google, maybe page 2 at most - but they're not clicking, then, all other things being equal, your metadata is probably suboptimal.
Next priority is keywords with lower impressions but still low CTR. These may be lower-volume search terms, but you could still do with improving your CTR - it's just not as drastic an improvement as it was with the higher- impression keywords. Or, maybe they're not low-volume terms, you're just ranking on page 2 or further, where less than 1% of people bother to go. In that case, that could tell you that you need to do other optimizations for that page to make it rank higher, then rerun the analysis later.
Finally, you get anything that already has a high CTR. If it's got low impressions, you could do with finding out why, but this is definitely outside the scope of this project. So, all in all, for the analysis above, the priority of the clusters is blue-green, green, blue, black, yellow.
This project uses various Python data science libraries - namely, NumPy, Pandas, MatPlotLib, and SciKitLearn - to effectively cluster impression and CTR data and present them in a visual format which - for someone with a marketing background - provides actionable insights.
It begins by taking a CSV file which has been downloaded from Google Search Console and preprocessed. The data is initially plotted, then relevant columns are selected and the data is standardized. Clustering is done using k-means and the elbow method is used to decide on a number of clusters, which is manually inputted by the programmer (until I build a UI for this, at least). If the number of clusters seems inappropriate, this section of code can be rerun with different cluster numbers until the clustering is satisfactory. (The elbow method does help with this decision, but we all know this type of elbow can have more than one hook.) Finally, the points are plotted and color-coded according to one of MatPlotLib's default color schemes.
Python was my very first programming language, which meant for a long time I did very little with it. Until recently, the only thing I'd ever done was build the ubiquitous "choose your own adventure" game.
However, recently I picked Python back up in order to do data science and machine learning with it. I learned with the Complete Data Science Bootcamp, which is an excellent overall introduction to Python, statistics, data science, machine learning, AI, deep learning, and neural networks, plus everything I've heard called an 'important machine learning library', including TensorFlow.